As design finally became a priority in OKX, the design and research teams wanted to establish a consistent way to measure UX and fix scattered, low-quality surveys.
1. No Consistent UX Metrics
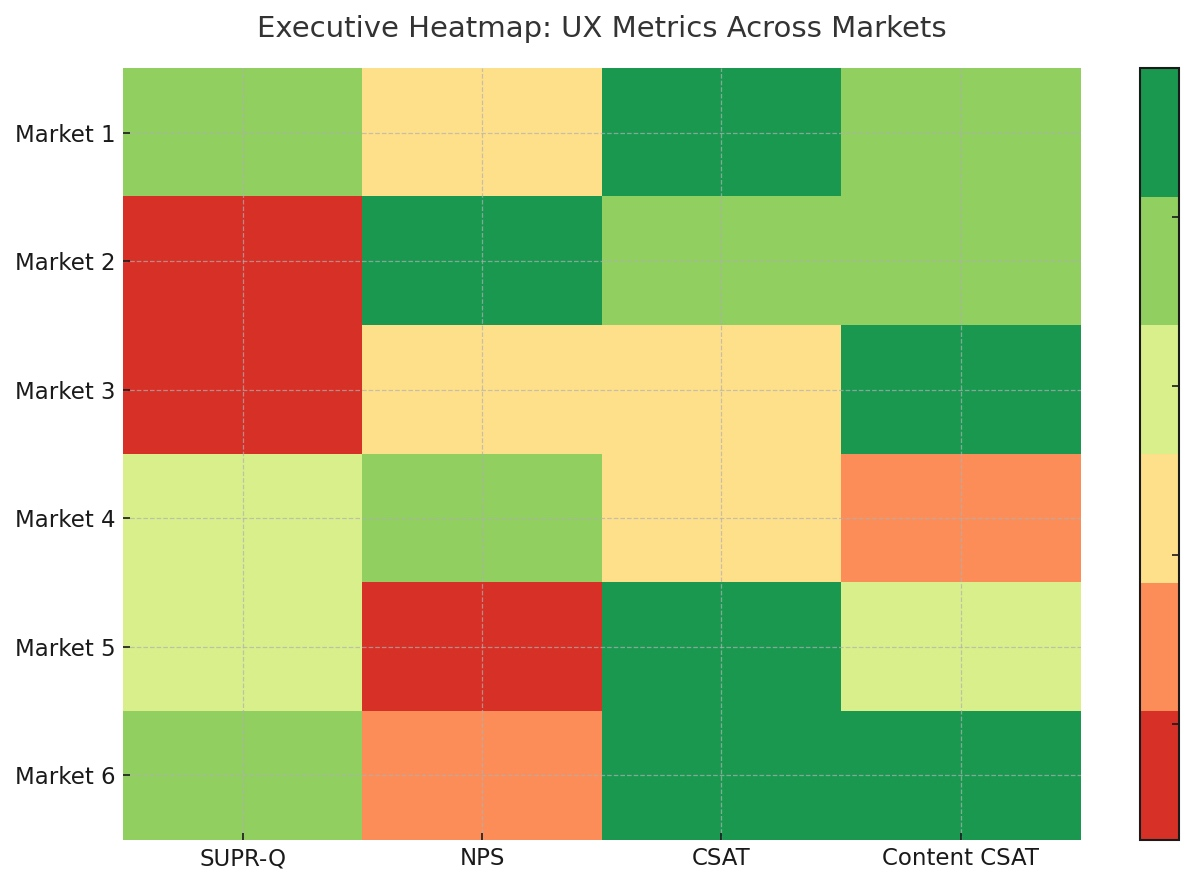
Rich qualitative insights existed, but no consistent, quantitative way to measure UX. Leadership couldn't validate if changes improved UX or compare across markets.
2. Qual Data Alone Wasn't Convincing
Small-sample findings were sometimes dismissed. Quantitative benchmarks were needed to make insights more persuasive and actionable.
3. Siloed, Low-Quality Surveys
Different teams sent surveys independently with varying quality, compromising feedback, risking survey fatigue, and undermining brand credibility.
A multi-channel survey to track satisfaction and drive improvement quarterly
I proposed a multi-channel survey approach addressing fragmented surveys and the lack of a consistent UX metric.
Research plan
Use a trio of methods — email, KOLs & followers, and in-app surveys — to reach different user segments, improve response rates, and reduce method-specific biases (e.g. recall bias).
Complete survey setup, distribution, and reporting in 2 months
The plan: deliver results for the CEO-UXR team meeting on a non-negotiable deadline.
Confirm survey scope, UX metrics, and design survey. Coordinate with content design (email invites) and legal (incentive + content approval). Work with localisation for translations and PM/front-end engineers for in-app survey build.
Launch surveys across multiple channels in batches, ensuring timely distribution. Planned targets: Email survey — 6 key markets, 1,000+ responses each (pilot of 100 per market before full launch). KOL & followers — 150–300 responses per market. In-app — ~1,000 responses.
Analyse quantitative and qualitative results. Coordinate with local team members to review translation and synthesised findings. Compile findings into a comprehensive report (overall + country level) tailored for leadership and the CEO meeting.
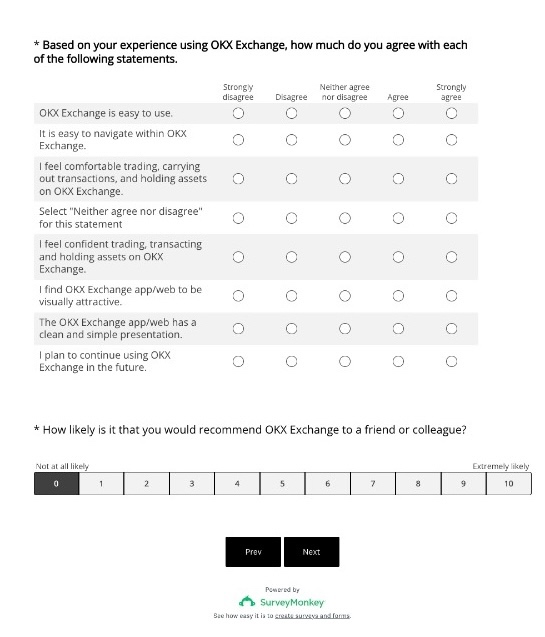
16 questions. Three sections. One clear framework.
I designed a survey combining SUPR-Q and CSAT for quantitative UX metrics with qualitative questions to identify the "why" behind scores.
Section 1: UX Metrics & Usability
SUPR-Q selected as the core UX metric for comprehensive coverage of usability, trust, loyalty, and credibility. MC and open-ended questions probed dissatisfaction, weak areas, and usability issues.
Section 2: Content Quality & Satisfaction
MC and open-ended questions to evaluate content, as significant investment had been made in localisation efforts.
Section 3: About Users
MC questions captured profile and behaviour (frequency, device, primary exchange, switching intent). Direct responses preserved anonymity and allowed faster analysis under tight deadlines.
*An attention check question was also included to filter out straightliners and speeders.
Survey ready and approved — but delays, buy-in hurdles, and underperformance forced adaptations
- Trio-distribution channels: Email + KOL & followers
- Trial competitor benchmarking via KOL followers
- Survey distribution via email in Week 3
- In-app survey and KOL channels required more time to get buy-in
- New email platform not ready — distribution date delayed by 2 weeks
- Non-negotiable deadline
- Email distribution only
- Shorten data processing and analysis time:
- AI translation for qual feedback
- Pre-built templates for faster quant analysis
10,000+ responses in under 5 days across 6 markets
With support from 6 different teams, I successfully distributed the survey across 6 key markets in 7 different languages.
I enlisted support and guidance from leaders in marketing, customer support, email platform, localisation, content design, and legal teams on survey distribution flow, translations, email invites, and T&C review.
Set up survey in 7 languages across SurveyMonkey and Pollfish. Optimised survey experience to reduce fatigue by keeping it short, starting with easy questions, and ending with demographics to minimise drop-off before key UX metrics.
Piloted with 100 users per market to validate translations, flow, and functionality. Rolled out in controlled batches (starting with 5,000 sends) and paused once target responses were reached.
End-to-end survey analysis
I executed analysis from template building and data validation to cross-group and cross-market analysis with integrated qualitative-quantitative synthesis.
Created a Google Sheets template to auto-calculate metrics, expediting analysis once data arrived.
Removed invalid responses (failed attention checks, speeders, straightliners).
Fed data into the template, adjusted for language/market differences, and produced UX & content scores.
Compared metrics across groups (e.g. new vs. experienced). Ran statistical comparisons across six markets.
Translated qualitative feedback with AI, coded manually, and synthesised per market.
Analysed qualitative and quantitative findings by market, then holistically across all markets.
⚠️ Due to confidentiality, UX metrics and some qualitative details have been omitted.
Satisfactory performance overall — with clear gaps
⭐ Wins
Strong UX metrics across all markets. NPS rose 27% in one market, validating UX and localisation improvements. Small wins and unmet needs surfaced to build on.
🚨 Gaps
Usability challenges for new users. Technical issues like slow loading. Futures & margin trading interfaces less intuitive than competitors. P2P transaction reliability concerns.
Making findings actionable at every level
Prepared both consolidated and market-specific reports to make insights relevant at every level.
Organised Readouts
Organised readouts with all teams, followed by smaller sessions tailored to specific product owners and designers to drive action.
Dual Recommendations
Provided both ideal long-term fixes and feasible quick wins to keep momentum while larger changes were in development.
Tracking & Follow-up
Tracked all findings in Jira and followed up regularly to ensure progress on identified issues.
"The survey results really helped my team in project prioritisation and also validated some usability issues we previously identified as well!"— Localisation Product Lead
I established OKX's first UX benchmark, creating a repeatable survey system across multiple markets that validated improvements and steered future product and research decisions.
By streamlining analysis with templates and AI translation, coordinating across 6 teams, and delivering results on a non-negotiable deadline, the benchmark became a cornerstone of how OKX measures and improves UX.
- Repeatable survey system across multiple markets
- Proof of effectiveness of localisation enhancements
- Made qualitative findings more persuasive and guided future research and product strategy
- Streamlined analysis with templates and AI translation
- Apply stronger statistical tests (t-tests, ANOVA, correlations) for rigour
- Pair ideal recommendations with feasible quick wins
- Building cross-team partnerships accelerates delivery and adoption
- Expand to in-app and KOL channels for broader coverage
- Implement competitor benchmarking via non-OKX user surveys
- Add inferential statistics for deeper cross-market insights